 Selling Your Present Home List Price – Actual Price in the MLS Target Price – What the Seller wanted to get Sale Price – What the Seller actually got DOM – Days On Market, how long it took to get an accepted offer (These averaged 35 Days) My Last 21 SOLD Listings List Price Target Price Sale Price DOM 229,900. 220,000. 221,000. 50 129,900. 125,000. 130,000. 1 282,500. 278,000. 278,000. 21 154,900. 152,000. 153,000. 3 116,900. 113,000. 110,000. 44 69.900. 69,900. 69,900. 3 194,900. 189,900. 191,000. 19 349,900. 340,000. 353,900. 14 295,900. 290,000. 289,500. 113 144,900. 140,000. 138,000. 21 172,900. 168,000. 162,500. 95 82,900. 79,000. 78,000. 17 178,900. 175,000. 175,900. 47 129,900. 120,000. 129,900. 2 154,900. 150,000. 155,000. 27 111,900. 109,000. 113,000. 8 119,900. 115,000. 117,500. 123 259,000. 250,000. 259,900. 8 116,500. 110,000. 105,500. 85 139,900.. 135,000. 136,500. 14 149,900. 140,000. 138,500. 71 24 Hr Cell/VM (260) 760-4655 Email Ed@EdMcCutcheon.com Licensed Broker Since 1973 IF YOU’RE BUYING – IT’S BOUGHT! IF YOU’RE SELLING – IT’S...
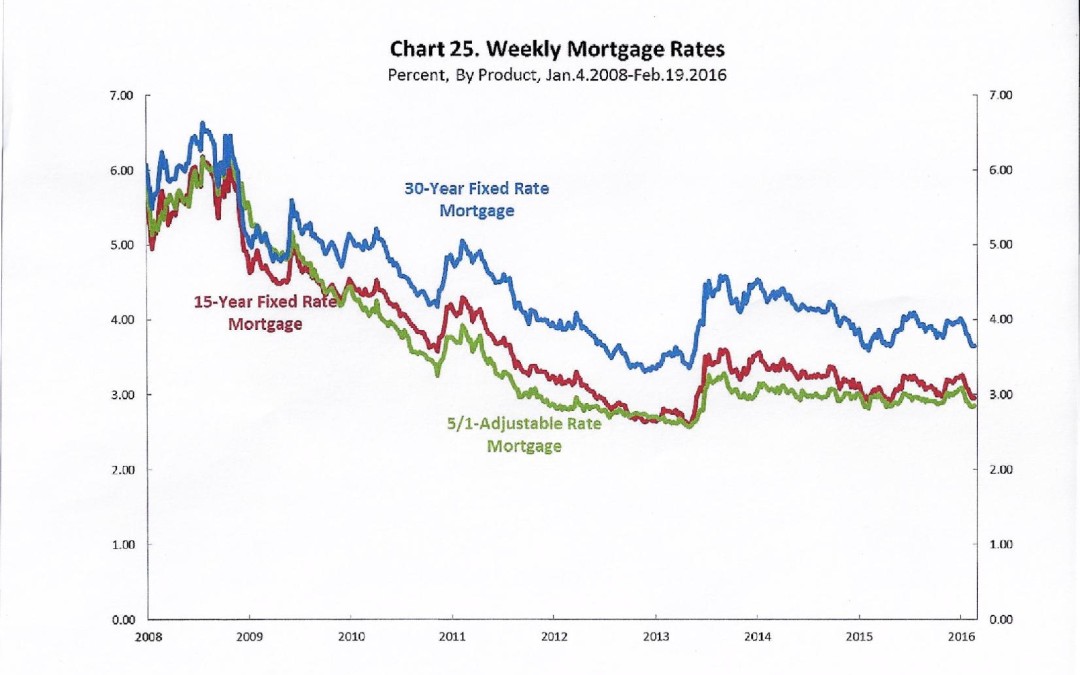 In case you were wondering, here is an 8 year history of mortgage rates....
 The Real State of Real Estate for 2015 It has been exactly 8 years since I last sent out my personal in-depth analysis of what really happened to the single family homes listed in the Upstar Association of REAL TORS Multiple Listing Service, specifically Allen County. In the years prior to 2006 my figures and the MLS had been different. However, in March of2006, after receiving my RSofRE letter for a number of years, the MLS Director changed the MLS’ method of calculation to the way I had been doing it and now both our statistics are nearly identical. And no, I did not get a trophy. Any/all numbers shown in red are adjusted to represent 2014 dollars based on the cost-of-living/inflation index. The 2014 Allen County Real Estate Market with Comparisons to 2006. Number of homes listed for sale; 7429 (14,336 in 2006) Number of homes sold and closed; 5,080 or 68.38% (8,118 or 56.63% in 2006) Number of homes that failed to sell and close as of December 31,2014; 2349 or 31.62% (6,218 or 43.37% in 2006) ( includes pendings, expireds, withdrawns and canceleds ) Average days on market (DOM) if you combine solds and failed to sell; 111 days (195 in 2006) (My average DOM for 2014 is 62 and my median is 25) Average list price; $145,563. In 2006 it was $153,564. Average sales price; $133,683. In 2006 it was $137,677. This means a net decline in average sales price of 2.9%. And all you hear about on the news and from the REALTORS is about the increase in property values. It’s not true. Average...
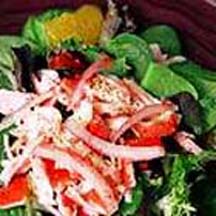 Crab Salad with Guava Dressing This salad is a complete meal – make it ahead for a quick, light dinner. enjoy with a tall glass of chilled Libbys Kerns nectar. Ingredients: 2/3 cup of Guava Kerns from Libby’s refrigerated All Nectar 1/3 cup mayonnaise 1/4 cup apple cider vinegar 8 cups mixed salad greens 2 cups cooked fresh or chopped imitation crab meat 1 can (11oz.) mandarin oranges, drained 4 red onions slices (optional) Directions: Combine nectar, mayonnaise, and vinegar in a small bowl; whisk until smooth. Combine 1/2 cup dressing with crab meat in small bowl. Toss remaining dressing with the salad greens in a large bowl. Divide salad greens among serving plates and top with crab mixture, oranges, and onion. Season with ground black pepper. Serving Size:4 Recipe and Photograph courtesy of Nestle USA and...

Recent Comments